Feature Map Visualization Using Tensorflow Keras.
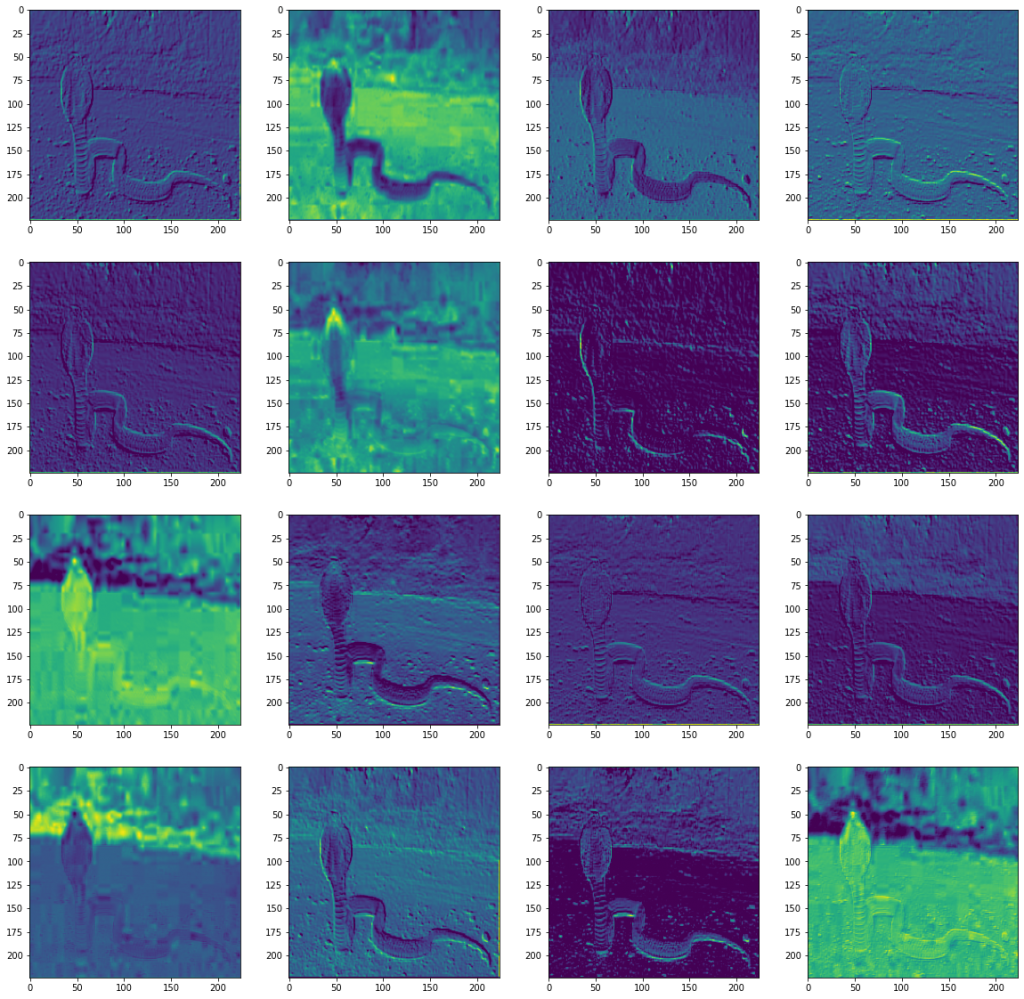
It is a good idea to visualize the feature maps for a specific input image in order to to understand what features of the input are detected in the feature maps. The expectation would be that the feature maps close to the input detect small or fine-grained detail, whereas feature maps close to the output of the model capture more general features We will demonstrate this feature map visualization using Tensorflow training in this article.
First we load the VGG16 pre-trained model as base model. We then create a model with base model inputs and base model layer 1 output
from tensorflow.keras.models import Model

base_model = VGG16(weights='imagenet')
activation_model = Model(inputs=base_model.inputs, outputs=base_model.layers[1].output)
We then load an image to the activation model input

Next, we can visualize the feature map of the first layer block1_conv1 as follows:
img_path = '/content/test.jpeg'
img = image.load_img(img_path, target_size=(224, 224))
img_tensor = image.img_to_array(img)
img_tensor = np.expand_dims(img_tensor, axis=0)
img_tensor /= 255.

activation = activation_model(img_tensor)

plt.figure(figsize=(20,20))
for i in range(16):
    plt.subplot(4,4,i+1)
    plt.imshow(activation[0,:,:,i])
plt.show()
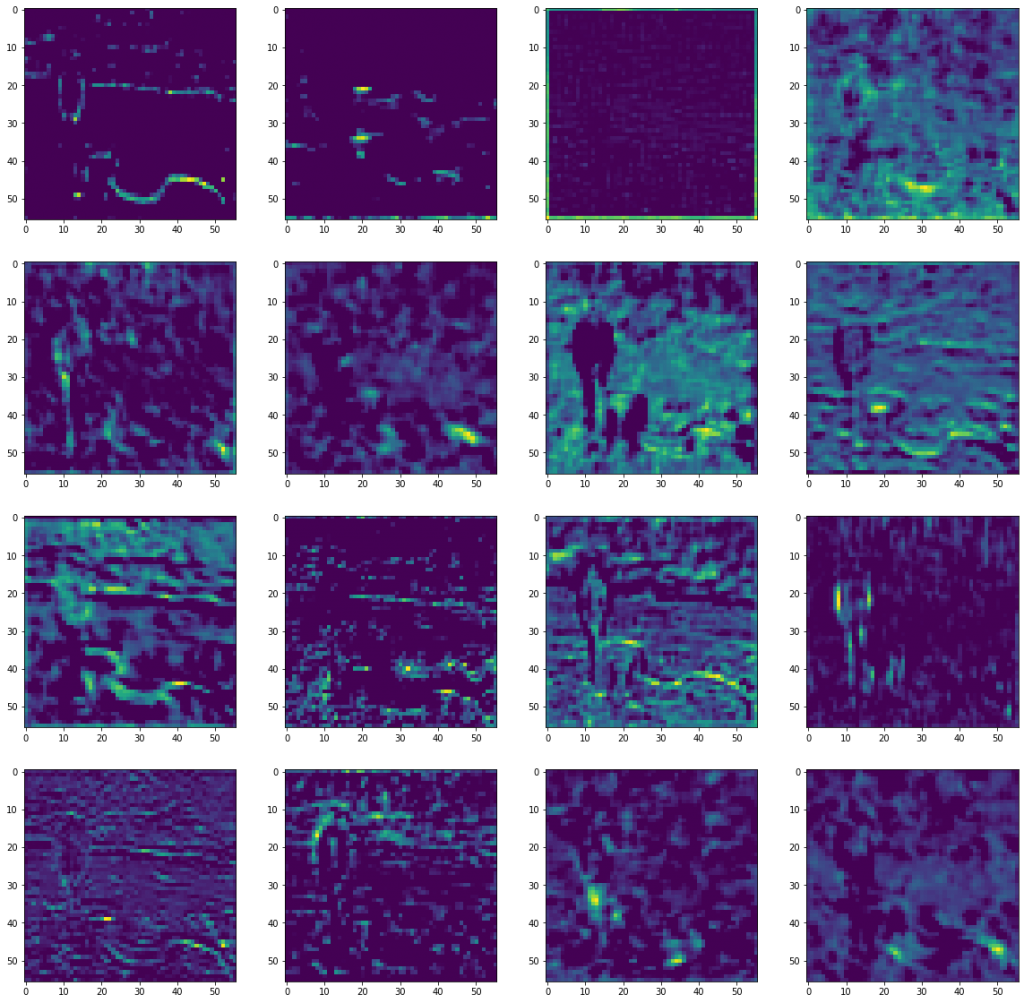
We also see the output from layer 7 block3_conv1

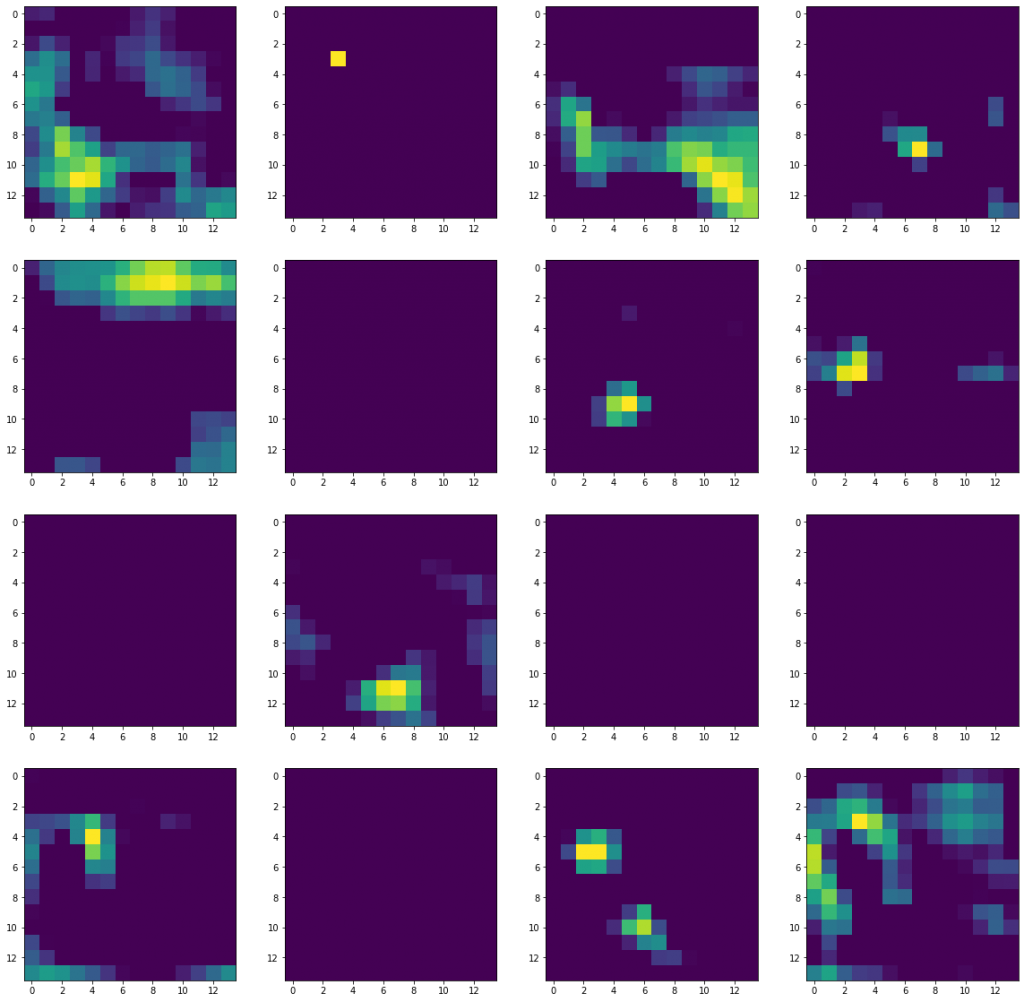
The output from the 17th layer block5_conv3

We can see there are a lot of fine details in the first layer feature map. The feature map is more abstract as layer progresses nearer to the output. This is consistent with our expectation.
